Factors that Impact Odometry
Authored by Cory
Often we’ve been asked what the impact higher frequencies, time synchronization, and synchronous API have on critical robot features, such as drivetrain odometry. This devblog will go into detail on the theoretical and practical impact they have.
Note
This doesn’t cover all the factors that impact odometry, but it includes some of the major ones that contribute significantly to odometry error.
Update Frequencies
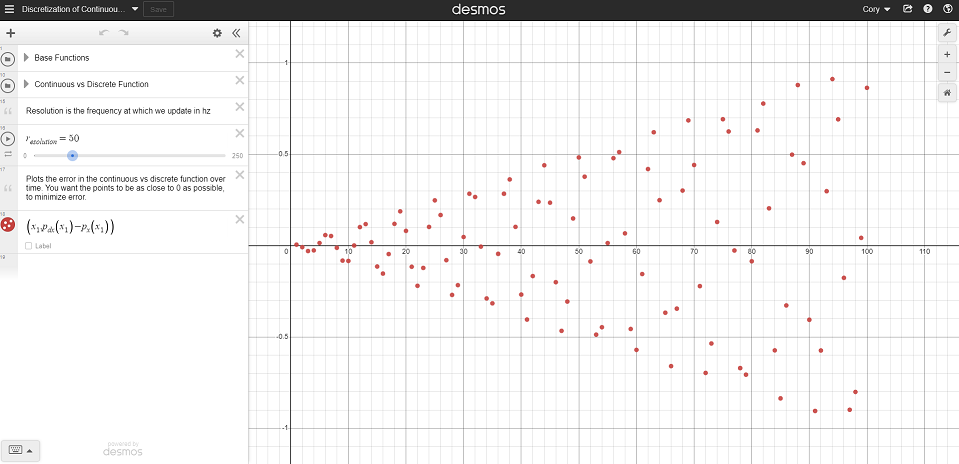
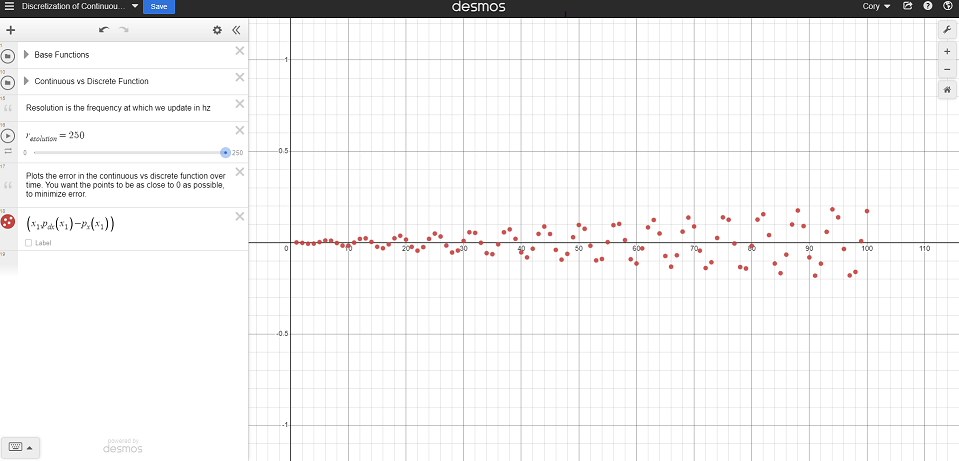
Update frequency has a direct impact on the accuracy of your localization through odometry, as it is an integration problem. The less frequent the odometry is called, the more time error can accrue before being updated to the present state of the robot. This can be seen graphically, the desmos session below shows the error in position, and how the error decreases as the update frequency increases.
https://www.desmos.com/calculator/vdgebi9s4t
Note
This desmos graph shows a Forward Euler discretization of a simple odometry case. The odometry solution provided by WPILib are discretized using the Pose Exponential, which is more accurate than Forward Euler.
Synchronous API and Time Synchronization
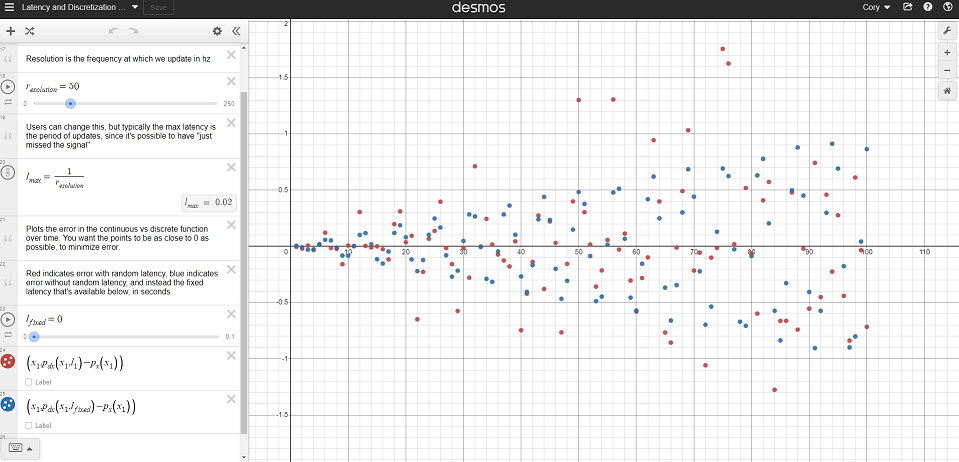
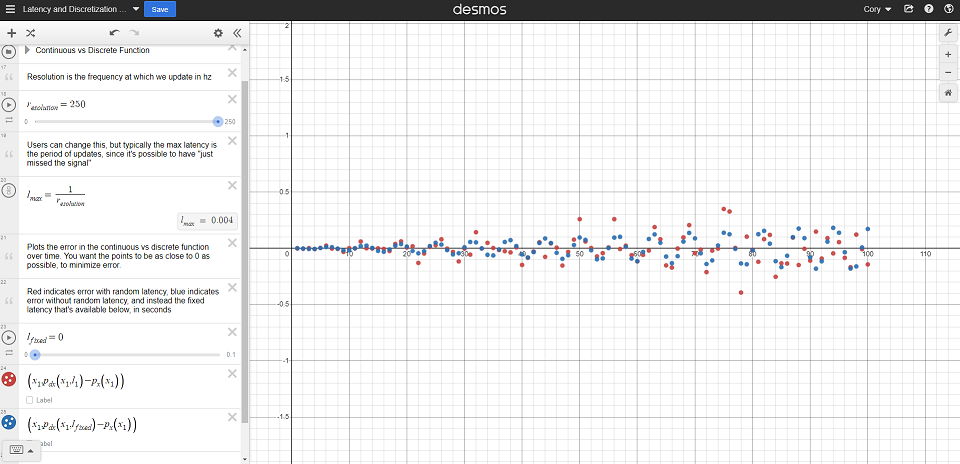
Synchronous API and Time Synchronization will further improve the performance of odometry. The two do this by reducing the overall latency of the signals and reducing the random distribution of latency involved in each signal. Further explanation of this is available in the Time Synchronization.
Latency reduces the accuracy of the data being used in the odometry, and with lower accuracy going into the odometry, the result will be less accurate as well (garbage in, garbage out concept).
We can add this into our desmos session, including the effect of latency and variable latency to our error calculation. https://www.desmos.com/calculator/rytssjj158
Practical Results
With the theory out of the way, we can see what kind of impact this has on the odometry of a real robot performing real maneuvers.
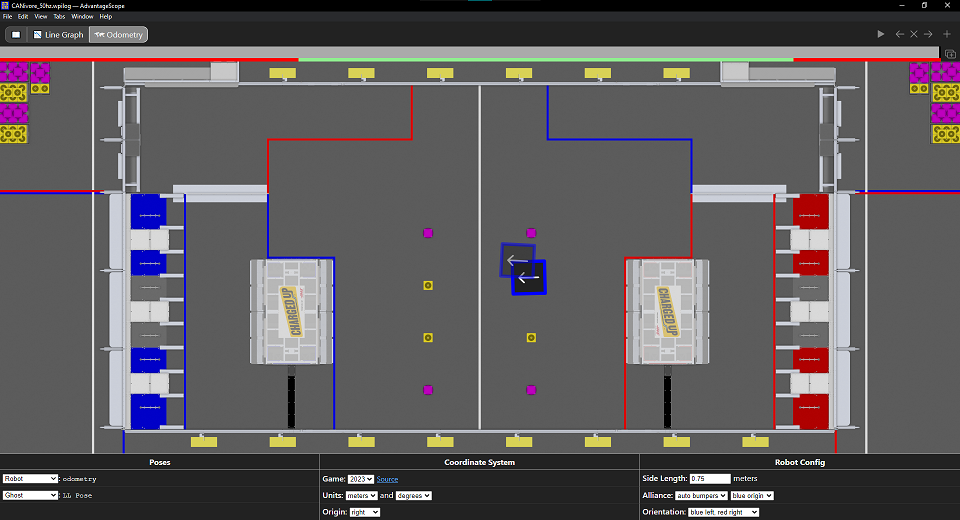
We took a swerve drive robot and, using our Swerve API, drove it around the office. Attached on the robot is a limelight pointing straight up to our ceiling, which has April Tags at regular points. This allows the Limelight to know the absolute position of the robot throughout the motion.
The Limelight is configured for a high resolution capture to reduce the error of its pose estimation, at the cost of less frequent pose calculations. This is acceptable, because as the robot performs its maneuvers, it will come to a rest at key points, and when it’s at rest, we can do our comparisons between the Limelight pose and the dead-reckoning from the odometry.
As we performed the maneuvers, we logged the pose of the robot as reported by the odometry and the Limelight for use in playback. The “real” robot pose is the odometry-driven pose, and the ghost is the Limelight reported pose. It can be assumed the limelight pose is the “true” pose while the robot is at rest.
Note
The Limelight pose measurements are not latency-compensated, so they will lag behind the odometry pose. The focus of this experiment is to see the difference in pose between the two methods while the robot is relatively still, so that this lag due to latency is not a factor.
- The same maneuver was teleop-driven under the following circumstances, with the results below:
CANivore CAN bus at 250 Hz (top left, measured at 45% CAN bus utilization)
CANivore CAN bus at 50 Hz (top right, measured at 16% CAN bus utilization)
RIO CAN bus at 250 Hz (bottom left, measured at 88% CAN bus utilization)
RIO CAN bus at 50 Hz (bottom right, measured at 45% CAN bus utilization)
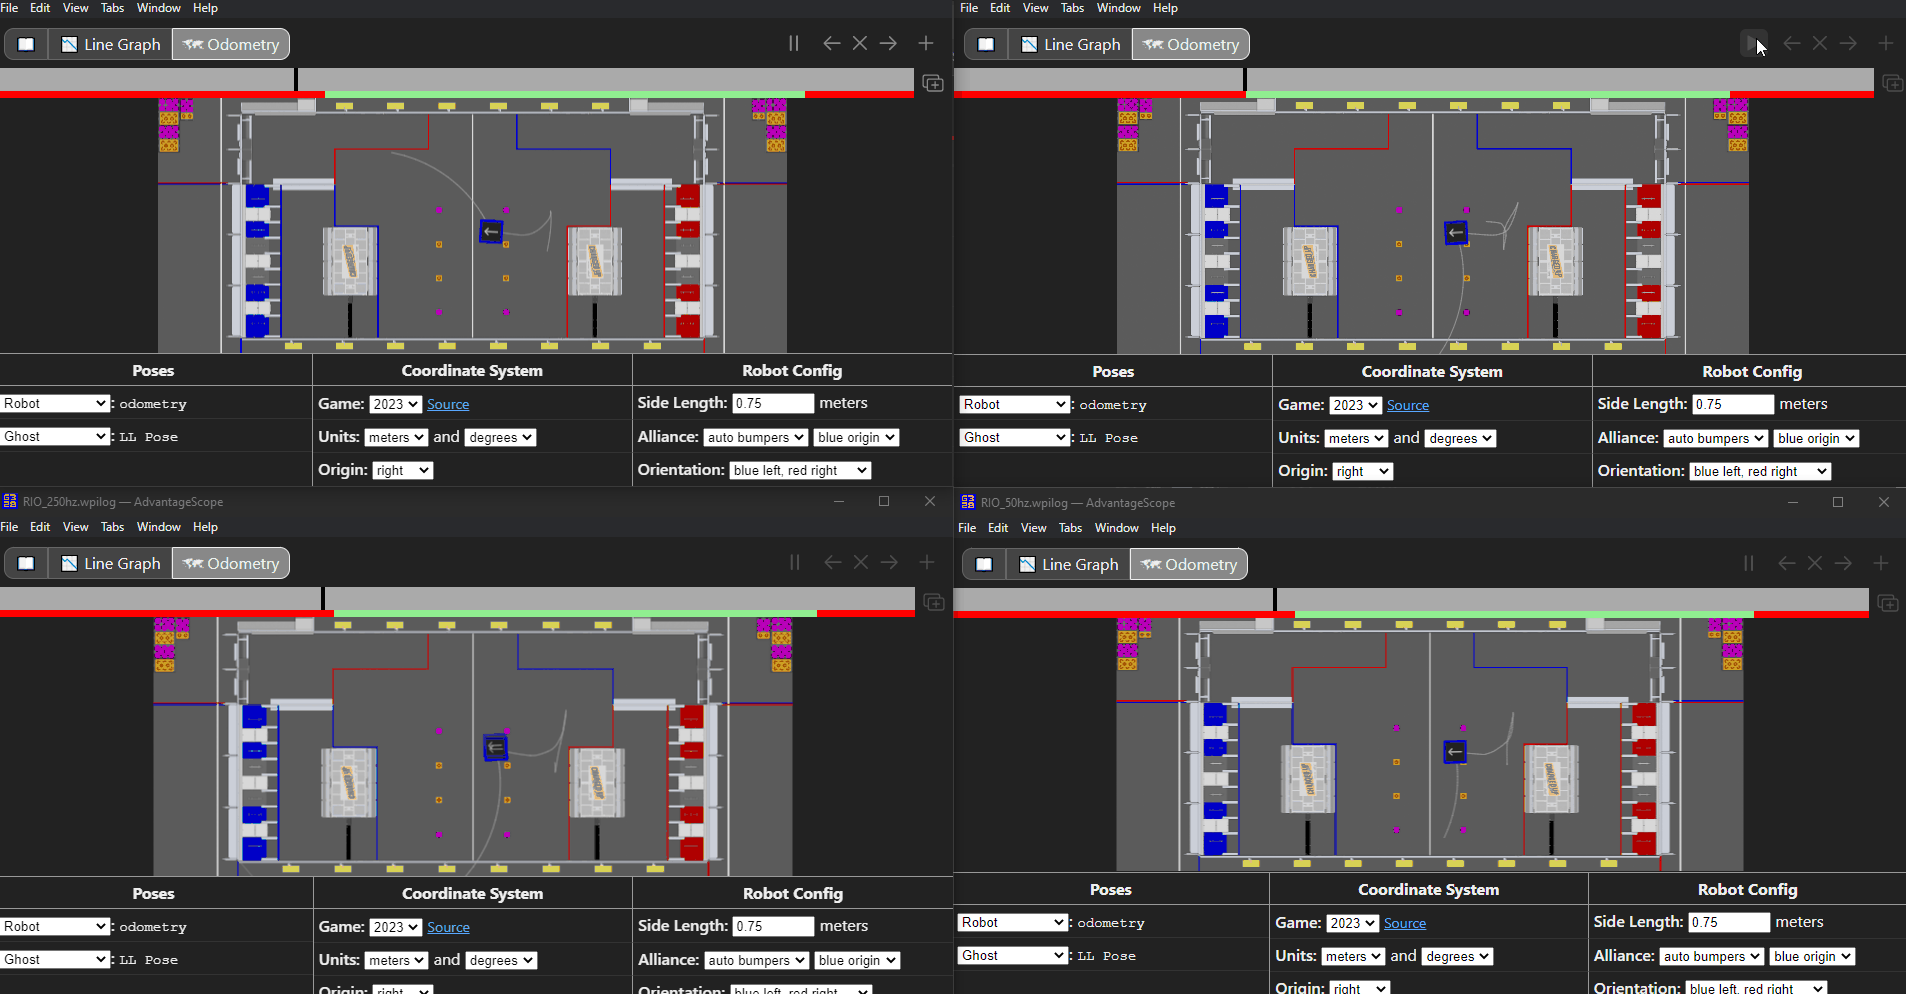
Final States

CANivore 250 Hz end position¶ |
CANivore 50 Hz end position¶ |

RIO 250 Hz end position¶ |

RIO 50 Hz end position¶ |
As can be seen, going from the RIO bus to the CANivore bus, or from 50 Hz to 250 Hz improves the accuracy of the odometry, and by a noticeable amount. Based on this, utilizing faster update frequencies and time synchronization from the CANivore should result in more accurate odometry, even for the “short” movements as shown in the gif.
Data on the pose location is available for download: OdometryData.xlsx.
After-Test Data
Roughly 2 weeks after this initial data was collected and the blog post written, we went back and re-verified the data for the CANivore 250 Hz and RIO 250 Hz cases to further test the impact of time synchronization. These tests were ran in autonomous a total of 20 times (10 for CANivore, 10 for RIO), measuring the error of the odometry against the Limelight data.
The results are below:
RIO |
CANivore |
0.52 |
0.14 |
0.33 |
0.28 |
0.47 |
0.56 |
0.23 |
0.22 |
0.51 |
0.32 |
0.23 |
0.18 |
0.22 |
0.30 |
0.59 |
0.26 |
0.15 |
0.33 |
0.11 |
0.25 |
This resulted in the following average and standard deviation of error:
RIO |
CANivore |
|
Average |
0.336 |
0.284 |
Standard Deviation |
0.173 |
0.114 |