Plotting
Phoenix Tuner X supports an accurate and highly performant real-time plotter. Users can plot and manipulate multiple signals simultaneously. Plotter has undergone strenuous stress testing to ensure hours of plotting operation. This can be used in conjunction with configs and control for tasks like tuning PID loops.
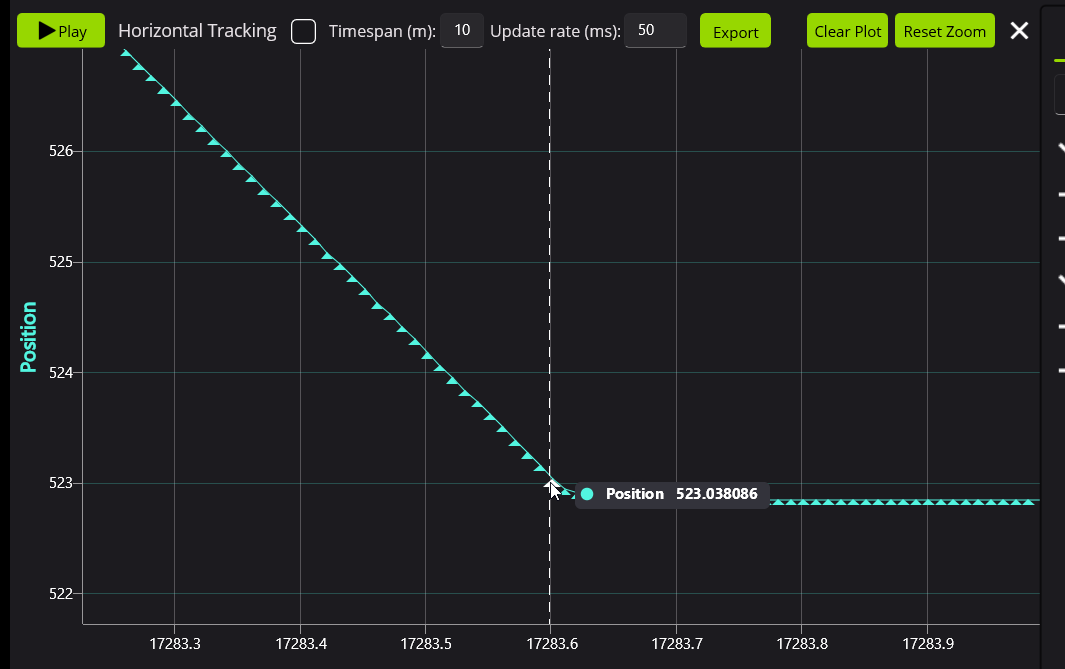
Tuner supports plotting signals as they arrive, ensuring that every visible point is a signal update that has been sent by a device. Users can zoom in and hover over points for a tooltip highlighting the exact value of the datapoint.
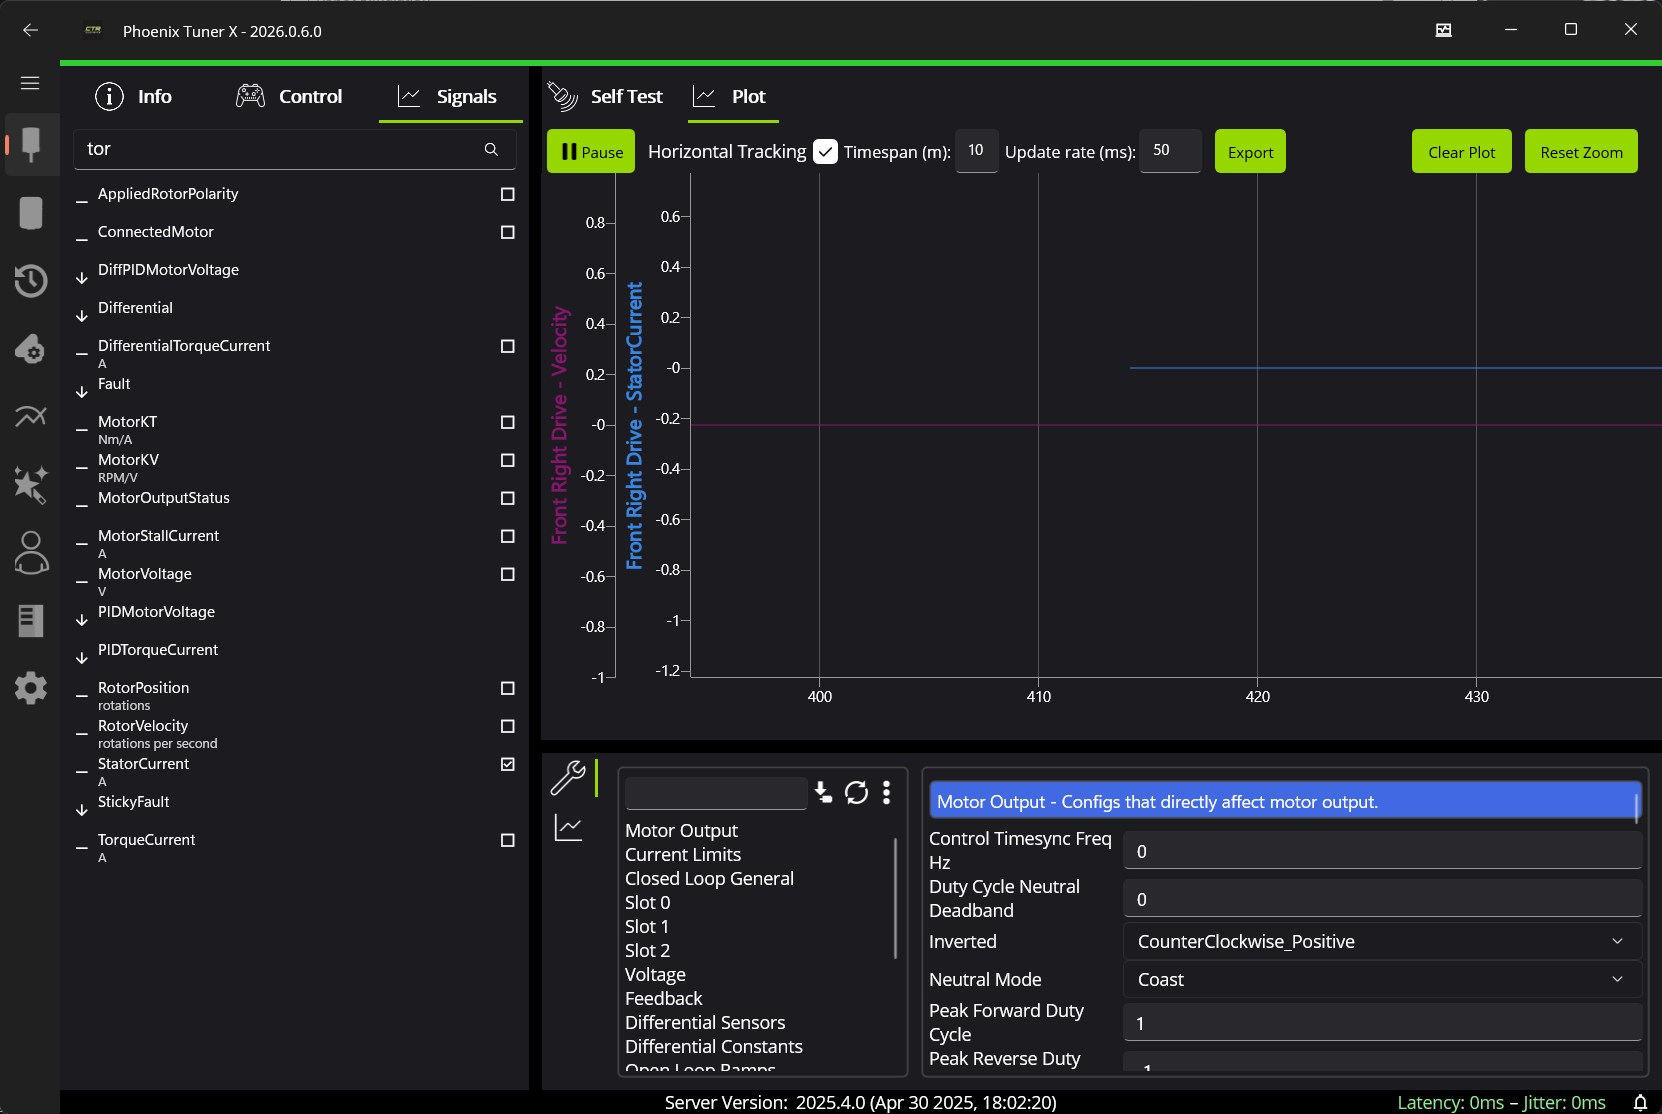
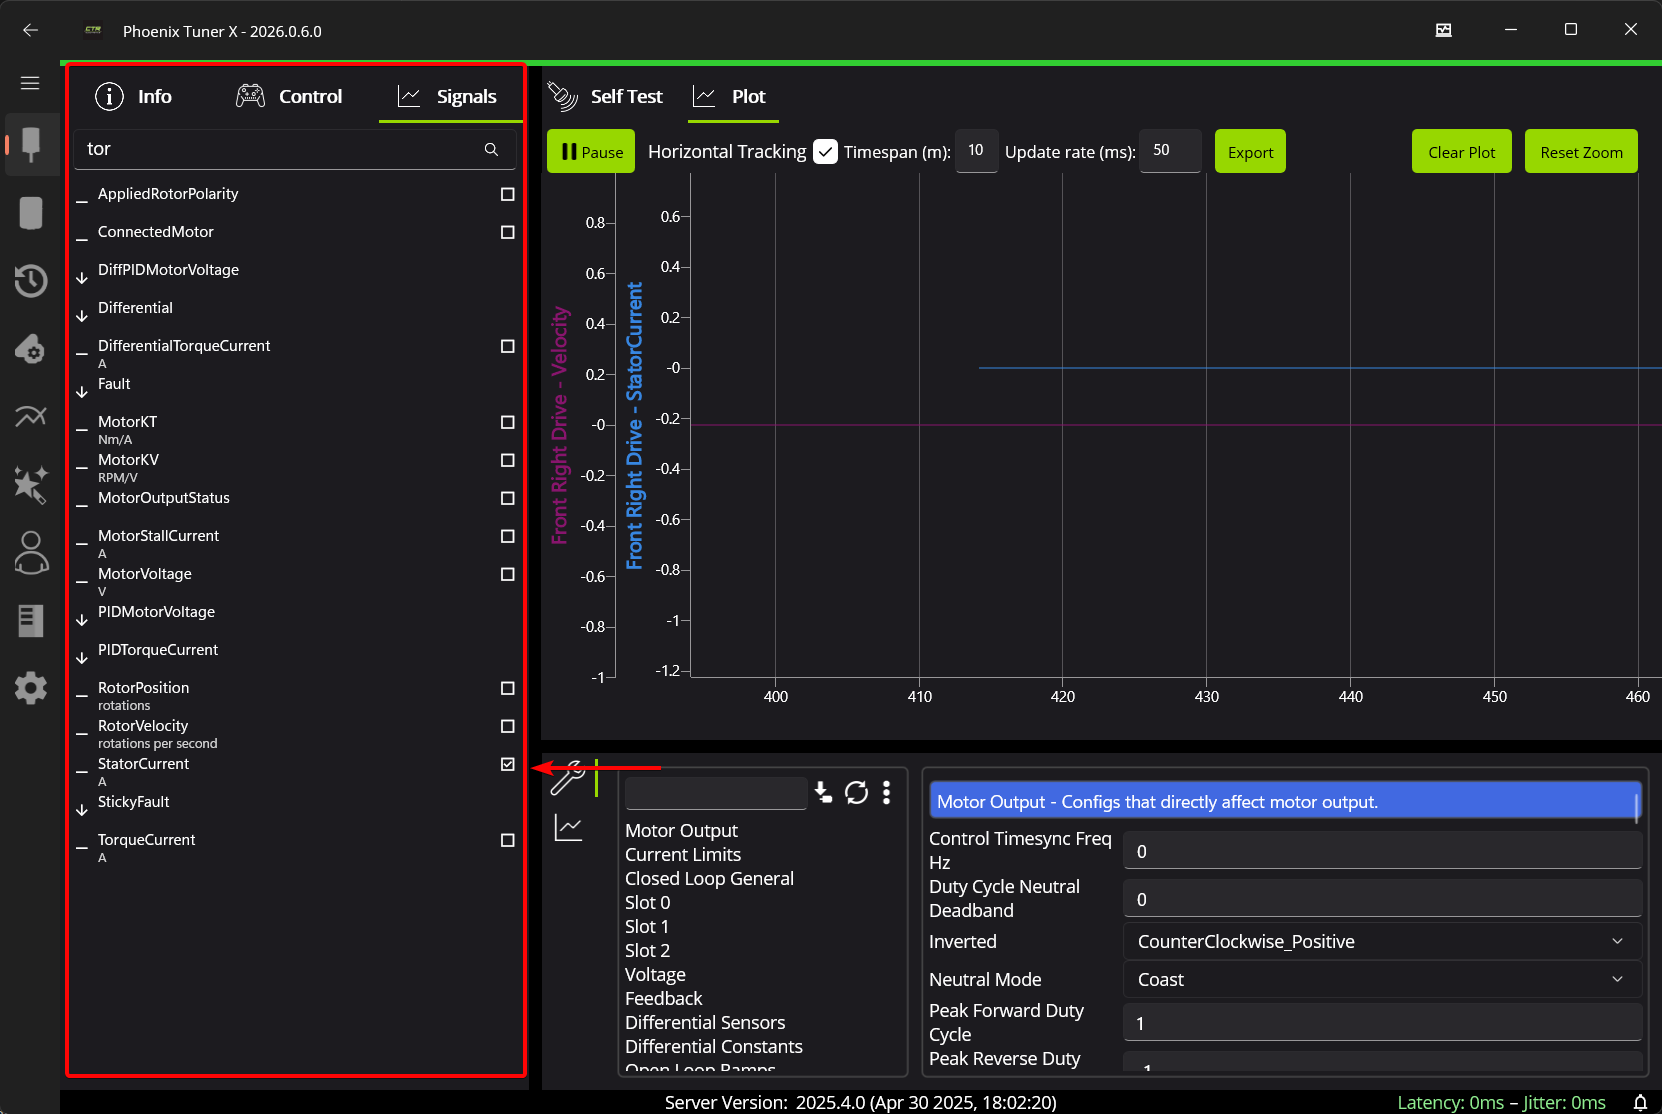
Adding a Signal
Signals can be added from the right-side menu.
Manipulating the Plot
The plot can be manipulated in a variety of ways:
Click + Drag to pan around the plot
Scroll over the X-axis or the plot to horizontally stretch the timescale
Shift + Scroll over a signal’s Y-axis to vertically stretch that signal
Shift + Scroll over the plot to vertically stretch all visible signals’ Y-axis
Ctrl + Drag to pan across all signals’ Y-axis
Additional Customizations
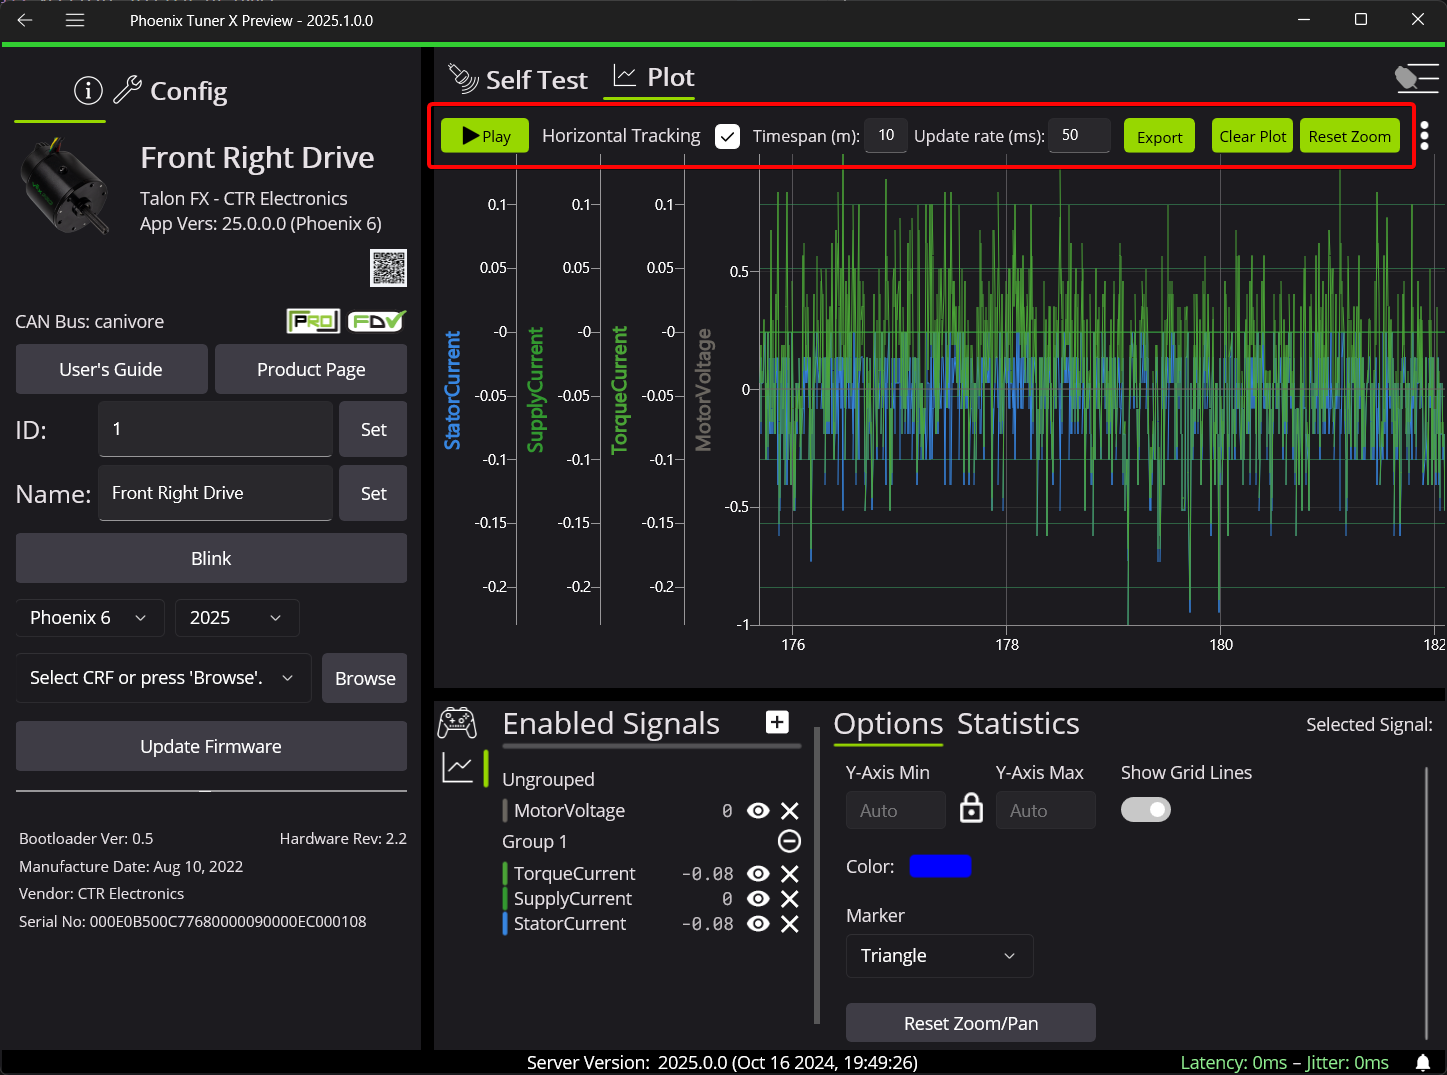
The topbar of plotter contains a variety of options used for controlling data collection.
Play: Play/Pauses the plotter. Points are not collected when the plotter is paused.
Horizontal Tracking: Whether the horizontal axis should be locked to the most recent point. This automatically turns off when pan operations occur. Users can click this checkbox to keep their current Y-axis min/max but resume seeking at the beginning.
Timespan: How long points should be kept before being discarded. Increasing this value will result in increased memory usage.
Update Rate: How often to fetch points from the diagnostic server. Update rates larger than 100ms may result in lost points and lower update rates will result in increased CPU utilization.
Export: Export currently visible signals to CSV.
Clear Point: Remove all points and reset the plot back to its default state.
Reset Zoom: Keep current points but reset horizontal and vertical zoom to its defaults
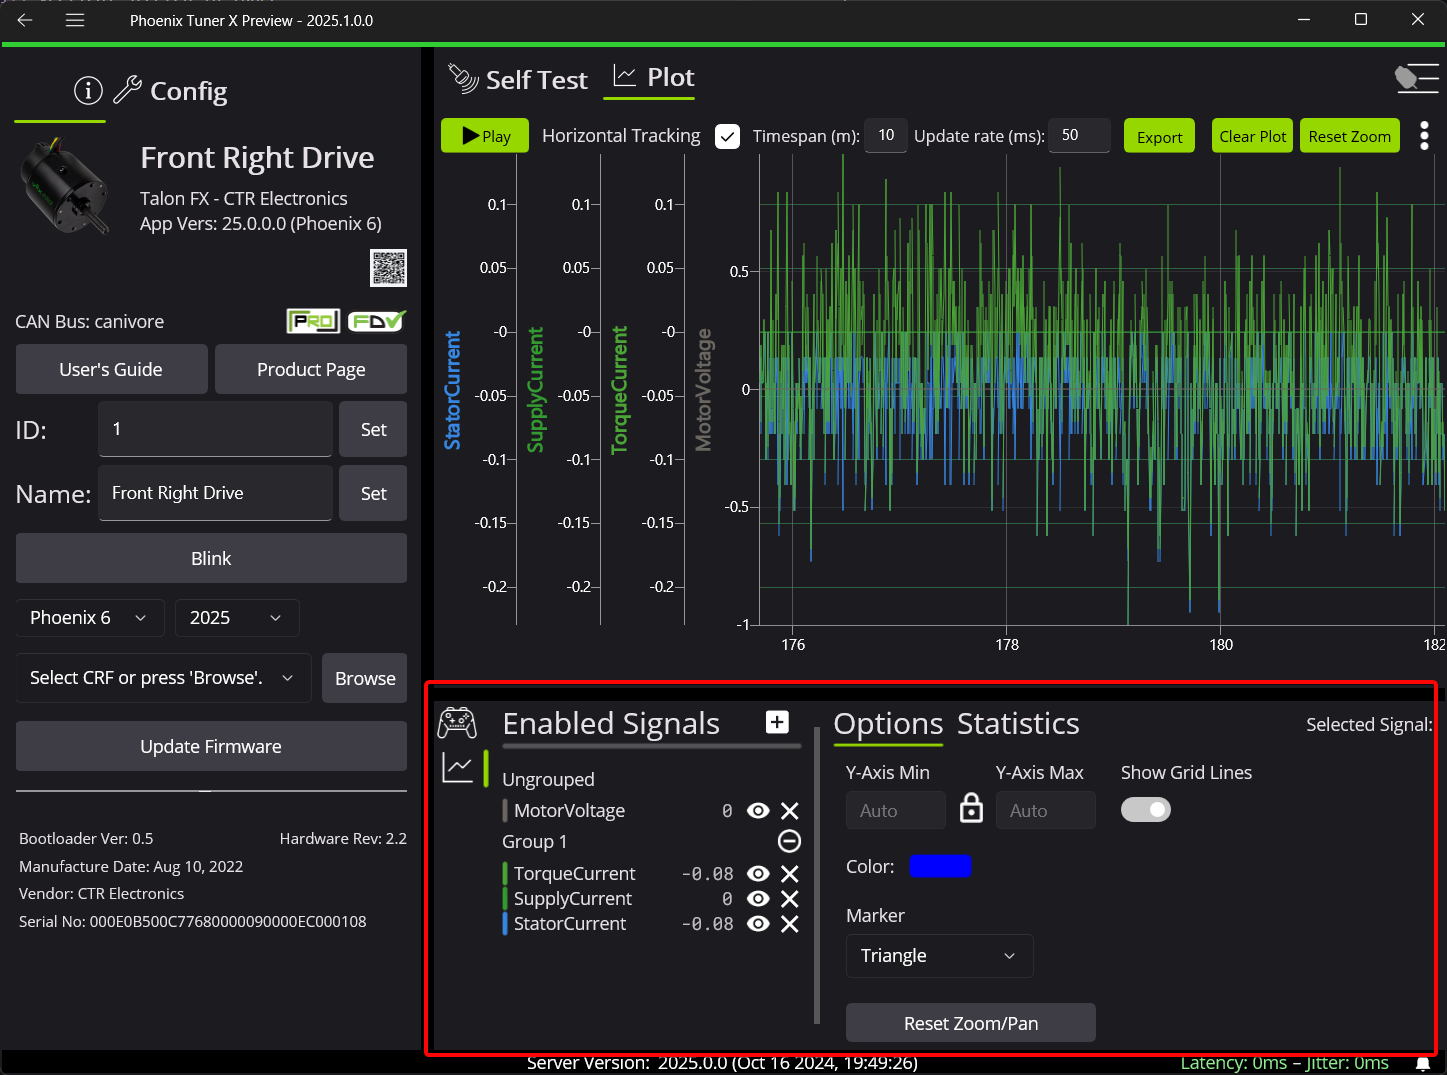
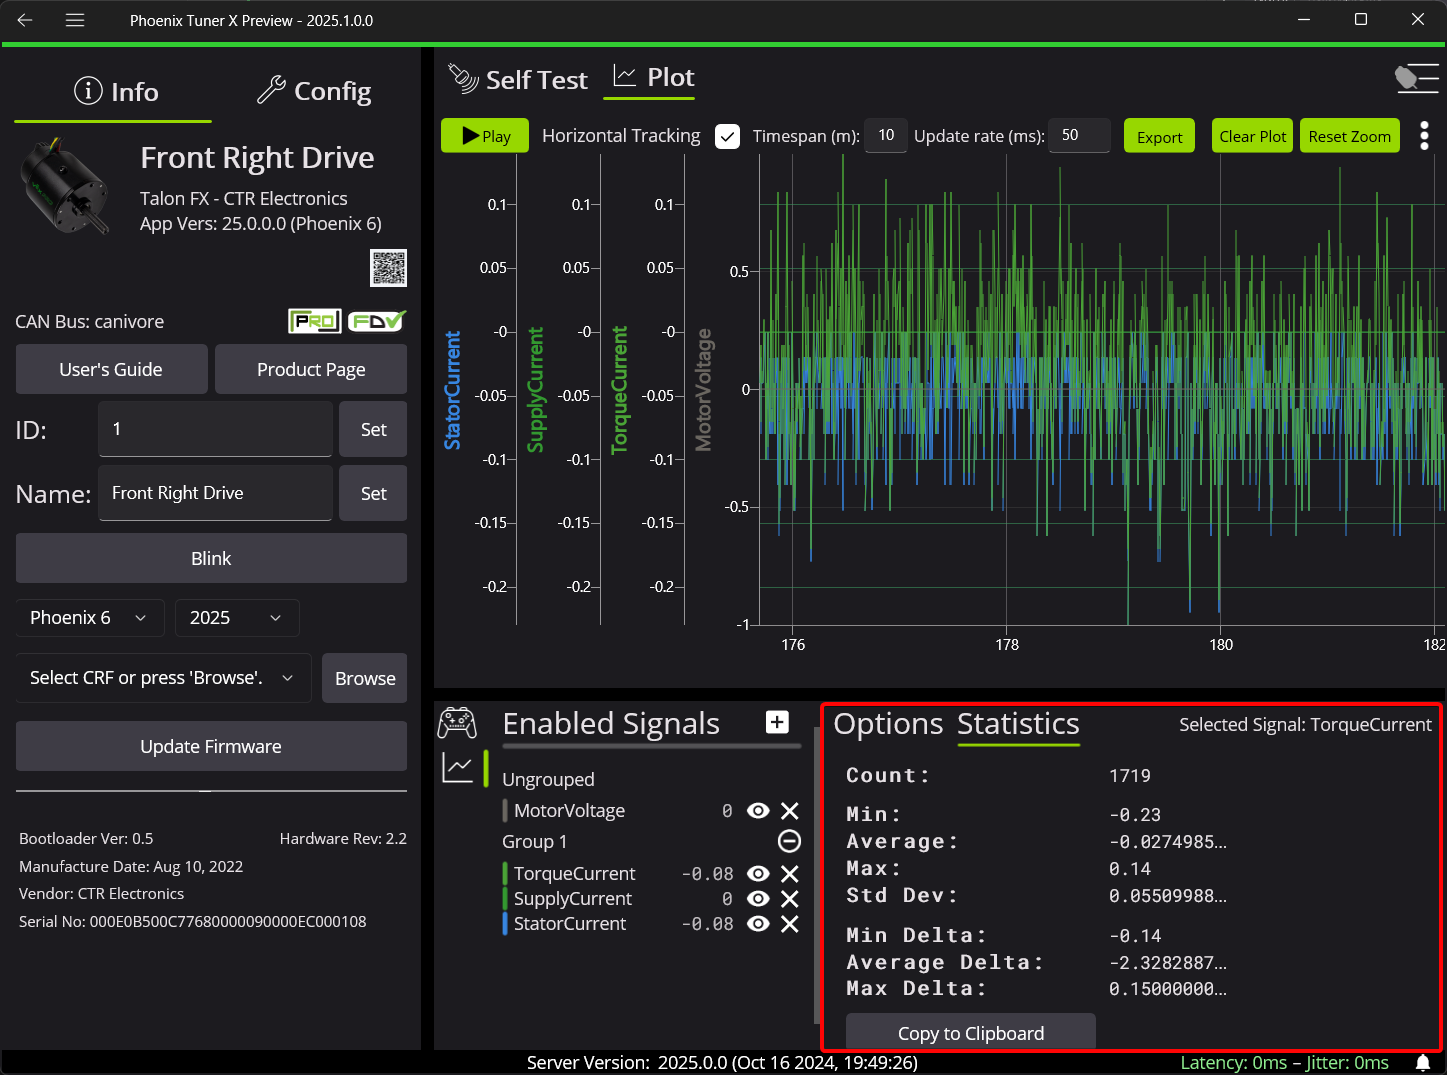
A plot customization tab is available at the bottom of the device view. This tab allows users to group signals together (create a group with the Plus icon, and then drag signals over the group name), customize the color of the signal, explicitly set min/max, etc.
Additionally, statistics for a signal can be viewed under Statistics.