Plotting#
Supported devices can have certain signals/sensor data plotted in real-time without any additional configuration. To get started, click on the Plot button in the top right navigation bar.
Tip
Plotting is supported in both Phoenix 5 and Phoenix Pro.
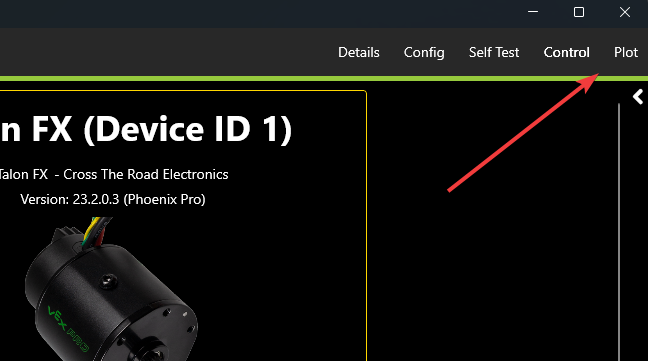
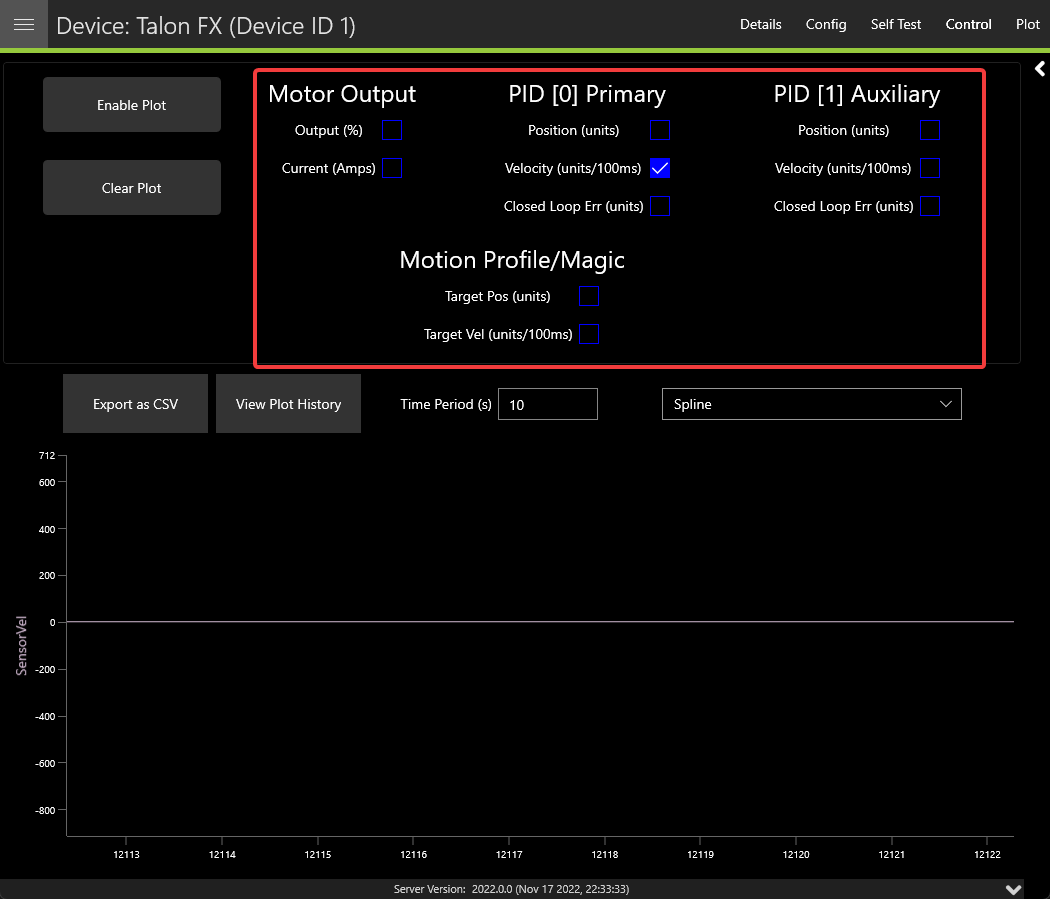
At the top of this page is a list of supported values that can then be plotted. Click on the signal that you wish to plot. Then click Enable Plot on the left.
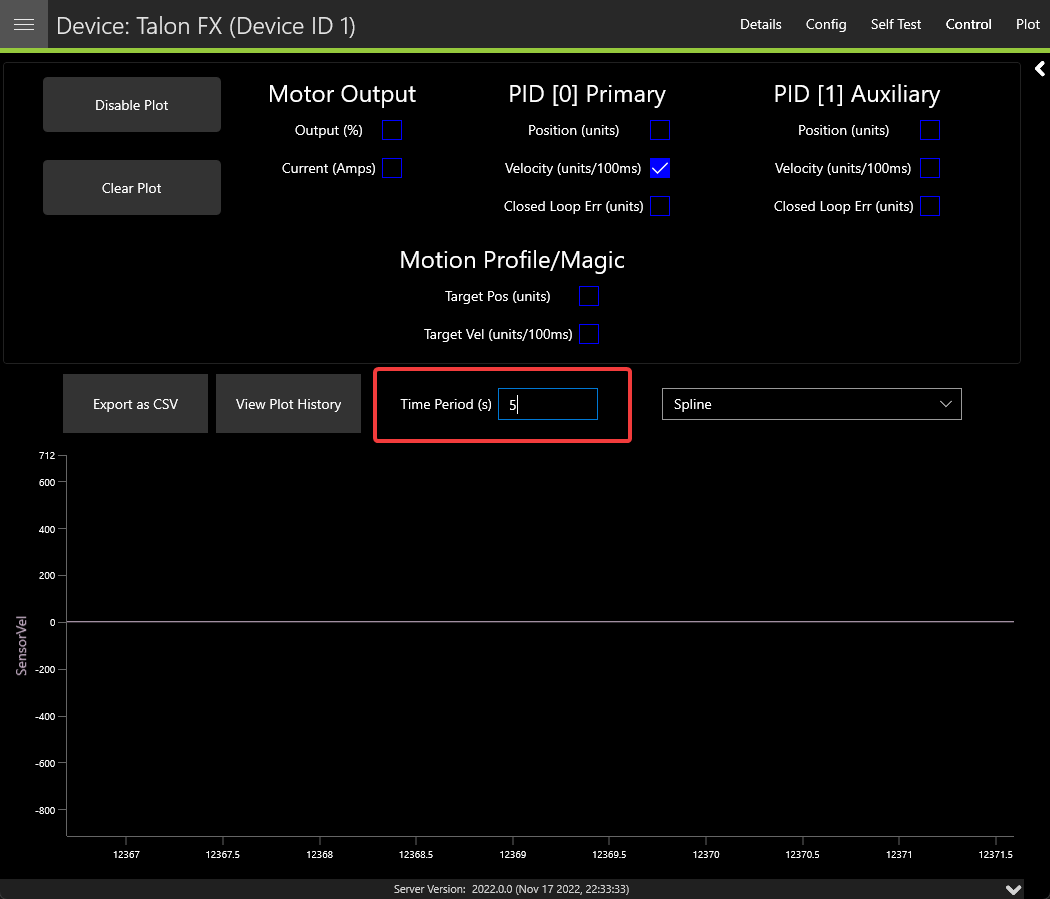
Adjusting Plotting Time Period#
Plotting time period (the time frame that points are recorded) can be adjusted using the Time Period textbox.
Exporting Data#
Plots can be exported into csv format for viewing in an external analysis tool. Click on the Export as CSV button.
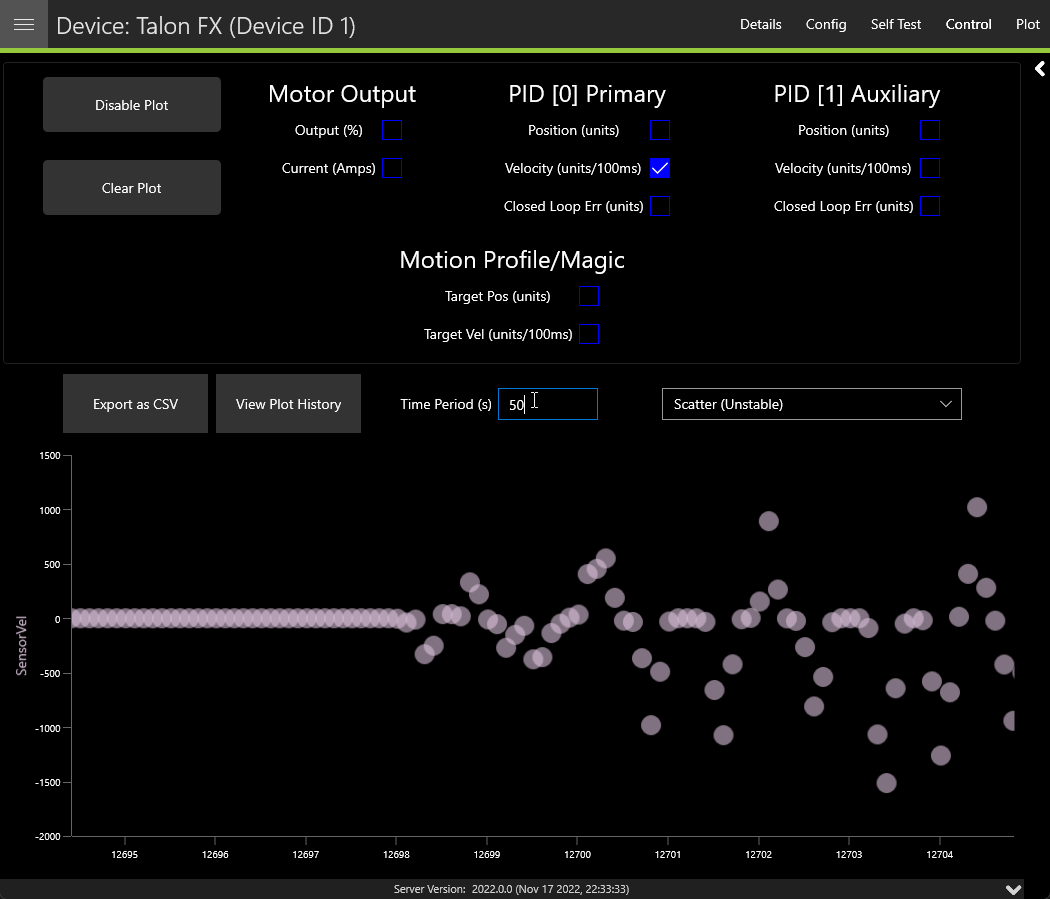
Plot Appearance & Behavior#
Important
Scatter points may dramatically affect Tuner X performance.
Plotting supports zoom and panning via the mouse and scroll wheel (or via gestures on Android). The point appearance can also be adjusted between “Spline” and “Scatter”.